- Using date/time data in Surfer
- Formatting Worksheet Cells to Use Date/Time Format
- Gridding Date/Time Data
- Creating Maps and formatting axes with Date/Time Data
- Solution to: Date/time data not being recognized correctly in Surfer
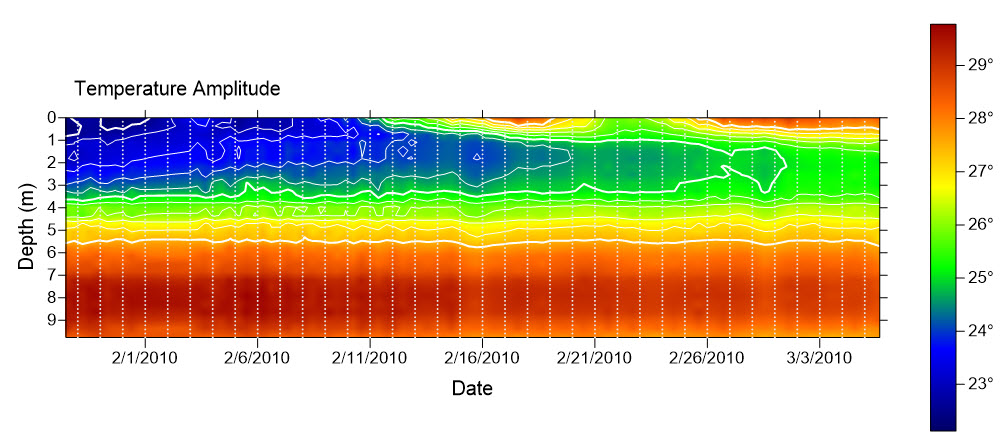
This example uses date formats for the X values in the grid and as labels on the Bottom Axis.
Using date/time data in Surfer
Surfer will automatically recognize the date/time data as long as one of these conditions is true:
- The data is in an Excel file format (XLS, XLSM or XLSX) and the cells are formatted as dates or times.
- The data is in TXT, CSV, DAT, ASCII, or another text format, and the data is in one of the standard U.S. Excel date/time formats, such as mm/dd/yy.
As long as one of the above conditions are met, then you can use the date/time data as any regular data. You can create a post map of the data or grid the data and create a contour map from the grid. The dates and times in the data file are internally converted to a number to grid and create maps from. To convert the numbers back into dates, format the axis labels with the Type set to Date/time and specify the desired date and time format.
If the data is not saved as dates or times in an Excel file, or the format of the data in the text file is not a U.S. Excel date/time standard format, the data will be imported into Surfer as text, not as date/time. For information on formatting worksheet cells in Surfer to use a date/time format see the next section, Formatting Worksheet Cells to Use Date/Time Format.
For example, please see Axes.srf (shown in image above) and Temperature_Samples.xlsx in the \Samples\ directory in the Surfer installation folder.
Formatting Worksheet Cells to Use Date/Time Format
Any worksheet cell can be formatted to show date/time in the worksheet. To format cells in the worksheet as date/time:
- Open the worksheet using the File | Open in Worksheet command.
- In the Open dialog, select the worksheet and click Open. For example, select the sample file Temperature_Samples.xlsx and click Open.
- Select all of the cells that should be date/time format. For the Temperature_Samples.xlsx file, highlight all of Column A.
- Click Data | Format | Format Cells.
- In the Format Cells dialog,
- Select Date/Time as the Type.
- In the Date/Time format field, enter the desired format or click the (...) button to open the Date/Time Format Builder.
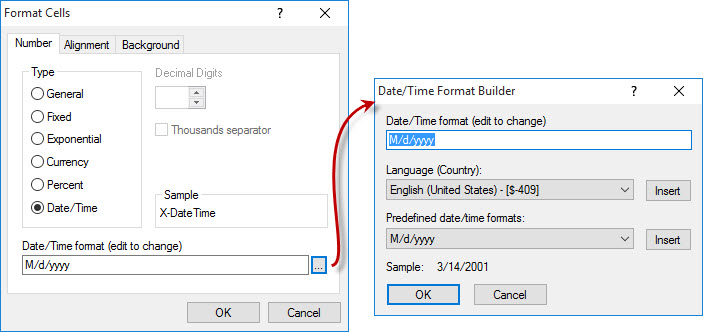
Open the Date/Time Format Builder window and select the desired format.
-
- Click OK and the selected cells are formatted using the chosen date/time format.
- Save to a format that retains the date/time format, such as an Excel file.
When a worksheet is created in another program, Surfer will import the worksheet showing the date/time format automatically if the data is in an Excel (XLS, XLSM or XLSX) file format and the cells are formatted as date/time. If the data are in TXT, CSV, DAT, ASCII, or other text formats, Surfer will import the worksheet showing date/time format automatically only if the data is in one of the standard U.S. Excel date/time formats, such as mm/dd/yy. If the format in the text file is not a U.S. Excel date/time standard format, the data will be imported into Surfer as text, not as date/time.
Gridding Date/Time Data
Any worksheet column containing numbers, dates, times or a combination of dates/times can be used for gridding. If using dates and/or times as a gridding variable, the date/time data need to be in a recognized date/time format (see above). When using date/time formats for any of the Data Columns, the values are stored in the grid as numbers, not in date/time format. The values are also displayed in the Grid Line Geometry section of the Grid Data dialog in numeric format. For this reason, it may be necessary to calculate the numeric equivalent of your date/time value. The value 2.00 is set to January 1, 1900 at 12:00 AM. An increment of 1 is equivalent to 1 day. So, 2.5 would be January 1, 1900 at 12:00 PM and 36526.00 would be January 1, 2000 at 12:00 AM.
To grid data using a date/time format:
- Click the Home | Grid Data | Grid Data command.
- In the Grid Data dialog, in the Dataset 1 section click the dropdown to select the worksheet or click Browse... to select the file and click Open. For example, select the sample file Temperature_Samples.xlsx and click Open.
- In the Dataset 1 section, select the appropriate X, Y, and Z using the dropdowns. In this case, the Column A: X-DateTime is used for the X data.
- Click Skip to End. (To view and/or edit the Gridding options click Next.)
Grid Data dialog.
- Notice that the Output Grid Geometry section shows numeric values, not date/time values. All Minimum, Maximum, and Spacing options are set in numeric Julian dates. A value of 1 is equivalent to 1 day. Set the Spacing in the X Direction to 0.125 to create a grid node every 3 hours.
- In the Output Grid section select the name and location that you want your output grid file to be saved.
- If you want a Grid Report, check the Grid Report checkbox below the Output Grid section.
- Click Finish and the grid is created.
- If a Gridding Report is created, notice that the statistics are also calculated using the numeric Julian dates for the X values.
Date and time values are displayed as numbers in the Grid Data dialog.
The Minimum value of 40206.47846 is equivalent to 01/28/2010 11:28:59 AM,
which is the first value in the worksheet.
Creating Maps and formatting axes with Date/Time Data
To display date/time formats on the map, select the appropriate map object (axis, map layer, or map) and set the date/time label format. For example, a contour map with date/time labels can be created by completing the steps below.
- Click the Home | New Map | Contour command.
- In the Open Grid dialog, select the Temperature_Samples.grd file created in the previous section and click Open.
- In the Contents window, click on the Axis that should display date/time values to select it. In this case, select the Bottom Axis.
- In the Properties window, click the Labels tab.
- Click the + next to Label Format to expand the section.
- Set the Type to Date/time.
- Click the (...) button in the Date/Time Format field.
- In the Date/Time Format Builder dialog, select the desired format from the list in the Predefined date/time formats field, click Insert, and then click OK.
- Click the Scaling tab.
- To control the starting/ending tick marks, change the First major tick and Last major tick. Both values are entered in date/time format. Highlight the existing values and type the desired date/times.
- To display more regular intervals, change the Major interval option. The Major interval is in number of years, weeks, days, hours, minutes, or seconds between ticks. Select the appropriate interval and set the number of that interval. For instance, to show a tick mark every 10 days, set the value to 10 and the interval to Days.

Set the Major interval to control the tick mark spacing.
Many other portions of the map can also be set to date/time formats using similar steps. For instance, post maps can display labels from the worksheet in date/time format by setting the Label Format to Date/time on the Labels tab. Contour map level lines can display date/time labels by setting the Label Format to Date/time on the Levels tab.
Solution to: Date/time data not being recognized correctly in Surfer
When a data file is created in another program with dates and times in it, Surfer will only recognize the data as dates and times if the data is either:
- The data is in an Excel file format (XLS, XLSM or XLSX) and the cells are formatted as dates or times.
- The data is in TXT, CSV, DAT, ASCII, or another text format, and the data is in one of the standard U.S. Excel date/time formats, such as mm/dd/yy. If the format in the text file is not a U.S. Excel date/time standard format, the data will be imported into Surfer as text, and then you can’t use it as real data.
As long as the date/time data is formatted to fulfill one of the above requirements, you can use it to create grid files or create post maps. You can set the label format Type to Date/time and then select the desired Date/Time Format.
|
Surfer versions 11 and previous do not recognize dates and times as valid data. |
See also:
Working with Date/Time Data in Surfer
Updated November 2021
Comments
Please sign in to leave a comment.