If you have multiple line plots in a graph and want to distinguish them using different colors, you can change the color of multiple plot lines at once.
- Select your graph.
- Click Graph Tools | Plot Tools | Change Colors.
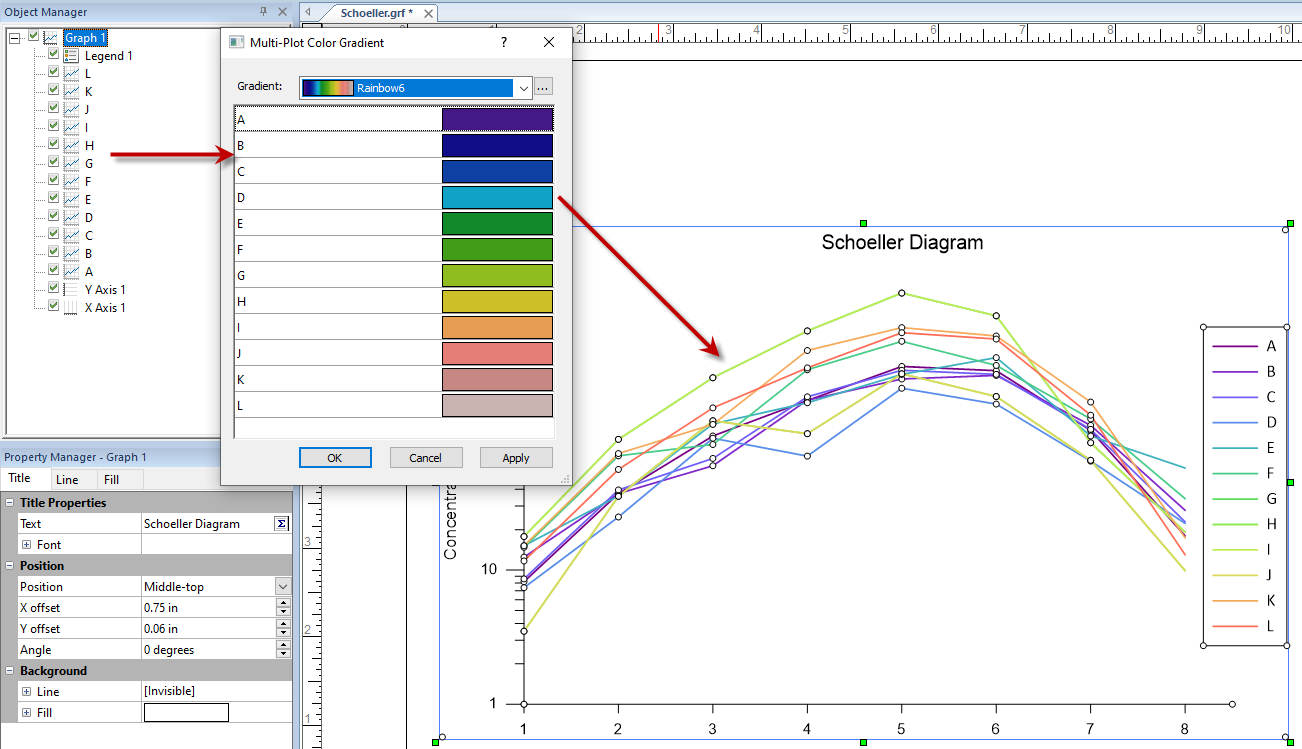
- In the Multi-Plot Color Gradient dialog,
-
- All applicable plots (line, step, bubble, bar, and polar line plots) in your graph are listed in the Multi-Plot Color Gradient dialog in the inverse order to how they are shown in the Object Manager.
- The coloring for the plots is determined by the Gradient list at the top of the dialog. Choose a preset colormap from the list or click ... to define or load a custom colormap. As plots are added or deleted, the colors are recalculated so as to keep the selected Gradient coloring.
- Click and drag the entries to reorder the plots. The colors will stay in the same order.
- Click on a plot and press DELETE to remove it from the list. Press CTRL or SHIFT to multi-select plots to delete. If you removed a plot that you want to add back, click Cancel and then reopen the dialog to reset the plot list.
- All columns in the list are read-only, so you cannot double click, right click, or just plain click on the plot name or line. You can change the properties for individual plots outside of this dialog by selecting the plot and changing its properties in the Property Manager. This dialog does a one-off change, so any changes made to individual plots after setting the gradient will overwrite the gradient color for that specific plot.
- All applicable plots (line, step, bubble, bar, and polar line plots) in your graph are listed in the Multi-Plot Color Gradient dialog in the inverse order to how they are shown in the Object Manager.
-
- After making your changes, click Apply to see the change on the graph and keep the dialog open, or click OK to make the changes and close the dialog.
Updated May 2023
Comments
Please sign in to leave a comment.