If your graph has many line plots, you may need to add plot titles to distinguish which plot represents a particular data variable. This can be done on a plot-by-plot basis, or for a mass selection of plots.
To set the plot title of many plots to the plot name from the Object Manager:
- Select the first plot in the Object Manager, hold CTRL on your keyboard, and click the other plots.
- On the Title page in the Property Manager, check the box next to Link title to plot.
- If you want the plot titles to be the same color as the plot, check the box next to Use plot color for title.
- In the Position section, define the position at which the titles appear along the lines. (see below for an image)
- The Anchor is what part of the line the title is aligned with (start, center, or end of the line).
- The Horizontal alignment is the edge of the title that is aligned with that location on the plot (left, center, or right edge of the title).
- The Vertical alignment defines whether the title is above, below, or centered on the line.
- Check the box next to Title along line to make the titles follow the curve of the line.
- If necessary, select individual plots at this point and update the Offset along line or X offset and/or Y offset to nudge each title into the exact desired location.
To set the plot title of an individual plot to something other than that plot's name:
- Select the first plot in the Object Manager.
- On the Title page in the Property Manager, click the Text Editor button in the Text field.
- Either type the desired title, or click the Worksheet and Insert cell buttons at the bottom to link the title to a specific cell from a specific data file.
- Set any other desired font properties, and click OK.
- If you want the plot title to be the same color as the plot, check the box next to Use plot color for title.
- In the Position section, define the position at which the titles appear along the lines. (see below for an image)
- The Anchor is what part of the line the title is aligned with (start, center, or end of the line).
- The Horizontal alignment is the edge of the title that is aligned with that location on the plot (left, center, or right edge of the title).
- The Vertical alignment defines whether the title is above, below, or centered on the line.
- Check the box next to Title along line to make the titles follow the curve of the line.
- If necessary, update the Offset along line or X offset and/or Y offset to nudge each title into the exact desired location.
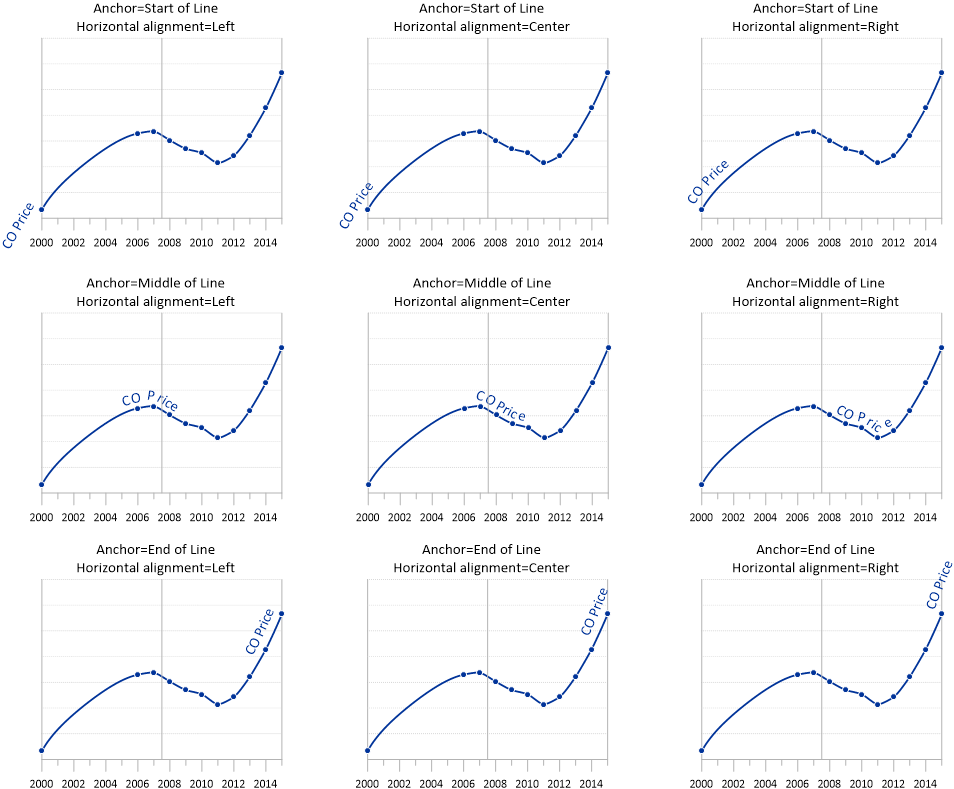
This image shows where the plot title appears for all possible combinations of Anchor and Horizontal alignment.
Updated March 2023
Comments
Please sign in to leave a comment.