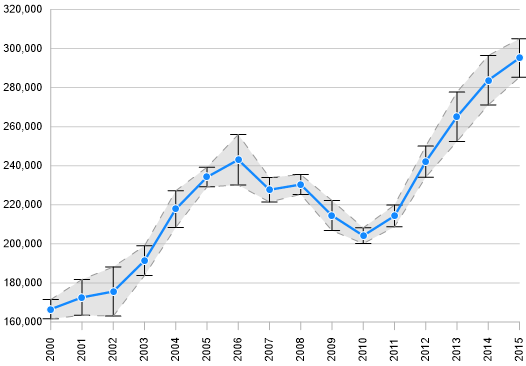
Convey the accuracy of your data measurements by adding error bars to your plots. Error bars help you visualize error envelopes more accurately. Use a line to connect your error bars, then fill in between them. Show your stakeholders there's nothing to hide and let your data speak for itself.
- Select your line plot.
- On the Error Bars page in the Property Manager, set the desired Direction of your error bars, and then set the type of error bar.
- Once your error bars are displaying, check the box next to Connect points.
- On the Line page, expand the appropriate "Connection Line" section in the Error Bar Line Properties section, and edit the line properties.
- On the Fill page, expand the appropriate "Connection Fill" section, and edit the fill properties.
Updated March 2023
Comments
Please sign in to leave a comment.