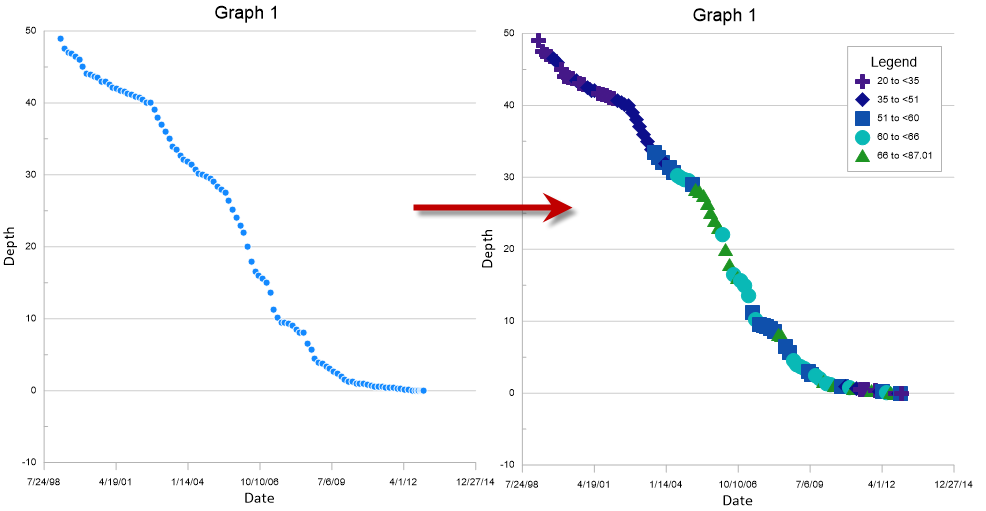
Enhance the clarity of your data by grouping points into classes or bins based on a third variable. You can can convert Grapher's Scatter Plots to Class Scatter Plots while retaining all of your graph and axis customizations.
- Select your scatter plot.
- Click Graph Tools | Convert | Plot Type | Class Scatter.
- By default, the next numeric column in the data file is chosen for the Class variable. To change this, select the class scatter plot and change the Class variable on the Plot page in the Property Manager.
Updated March 2023
Comments
Please sign in to leave a comment.