You can use Grapher to change the bar colors in 2D Vertical/Horizontal, 3D Vertical/Horizontal, and Category Vertical/Horizontal bar charts. Assign different fill properties, such as fill color, based on positive or negative values.
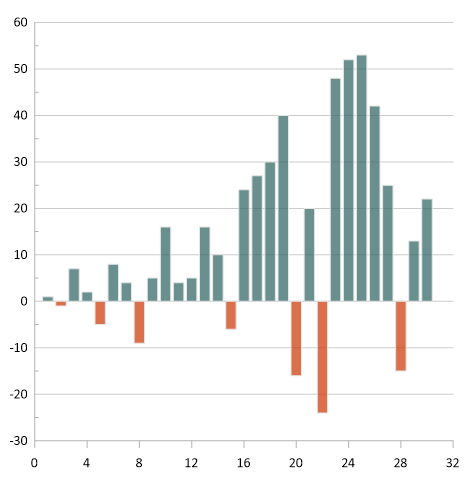
To color positive and negative bars different colors:
- Create the bar chart of your choice using the Home | New Graph | Basic | <bar chart type> select the data file and click Open.
- In the Object Manager, select the bar chart layer.
- In the Property Manager, on the Plot page, set the Base value in the Plot Options section to 0.
- On the Fill page, check the box next to Different fill if bars<base.
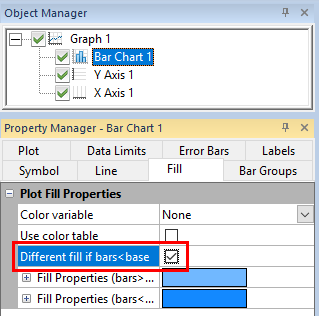
- Expand each Fill Properties section and select the desired Foreground color.
Updated March 2023
Comments
Please sign in to leave a comment.