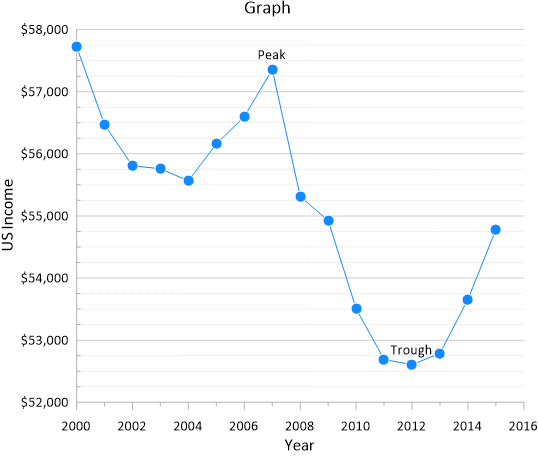
To label specific points on a plot in Grapher, you will need to add labels to the worksheet in a new column. You can then define the new column as the label column for the plot.
- Select your plot in the Object Manager.
- Click Graph Tools | Worksheet | Display.
- For each point that you would like labeled, enter the desired label in an empty column.
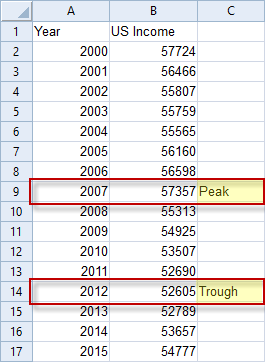
- If desired, enter a title for the label column in the header row.
- Click back to the plot document.
- With the plot still selected, click the Labels tab in the Property Manager.
- Set the Label column to the new column created above.
- Adjust the Label Position properties as desired.
Updated March 2023
Comments
Please sign in to leave a comment.