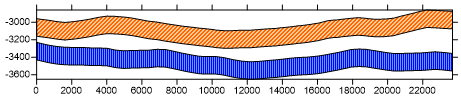
Need to visualize subsurface formations in Surfer? The Profile command works great for continuous or adjacent formations, but what about discontinuous ones—like a coal seam? That’s where the GridSlice method comes in!
The sample script below simplifies the process by using a single BLN file as the profile line in multiple Grid Slice commands. Each formation is generated by combining the top and bottom grid slices into a DAT file, representing a single formation. These formations are then added as base layers under one map frame, creating a clear and accurate discontinuous cross section.
To run the script, you’ll need grid files for the tops and bottoms of your formations, along with a BLN file for the profile line.
To run this script:
- In a Windows Explorer window, navigate to C:\Program Files\Golden Software\Surfer.
- Double click on Scripter.exe to launch Scripter.
- Copy and paste the script below into Scripter's code window (be sure to delete any existing lines first), or simply download the attached BAS file and open it in Scripter.
- Update the variables under the USER-DEFINED VARIABLES section at the beginning of the script:
- The path variable should be the path to the folder with your input BLN and grid files, and it should end with a backslash, "\".
- The numFormations variable represents the number of formations. You must have separate grid files for the top and the bottom of each formation.
- Click Script | Run to run the script.
- You will then encounter several dialogs in which you must first select the BLN file and then the top and bottom grids of each formation.
- Each grid slice output file will be saved at the location specified in the path variable.
Sub Main

    '===========================================
    ' USER-DEFINED VARIABLES
    '===========================================
    ' Define the path to the input/output directory
    path = "C:\Temp\"

    ' Number of desired slice formations
    numFormations = 2
    '===========================================

    ' Initialize Surfer
    Dim SurferApp As Object
    Set SurferApp = SurferApplication()
    SurferApp.Visible = True

    ' Create a new plot document
    Dim Plot As Object
    Set Plot = SurferApp.Documents.Add

    ' Prompt user for the BLN file containing the XY coordinates of the cross section line
    BLN$ = GetFilePath( , "bln", path, "BLN for slice")
    If BLN$ = "" Then End

    ' Initialize a map frame and a base layer object
    Dim MapFrame As Object, BaseLayer As Object

    ' Define an interval value that will be used to assign different colors to each formation
    Interval = Int( 255 / numFormations )

    ' Loop through number of slice formations
    For i = 1 To numFormations

        ' Prompt user for top grid
        top$ = GetFilePath( , "grd;dem;ddf", path, "Formation " + Format(i) + ": Select the top grid")
        If top$ = "" Then End

        ' Prompt user for bottom grid
        bottom$ = GetFilePath( , "grd;dem;ddf", path, "Formation " + Format(i) + ": Select the bottom grid")
        If bottom$ = "" Then End

        ' Define the output grid slice file names
        gridSlice_top = RemoveFileExtension(top$) + " formation" + i + " top" + ".dat"
        gridSlice_bot = RemoveFileExtension(bottom$) + " formation" + i + " bottom" + ".dat"

        ' Slice GRD files
        SurferApp.GridSlice(InGrid:=top$, BlankFile:=BLN$, OutDataFile:= gridSlice_top)
        SurferApp.GridSlice(InGrid:=bottom$, BlankFile:=BLN$, OutDataFile:= gridSlice_bot)

        '===============================================
        'Rearrange the data columns in the top and bottom DAT files
        '===============================================
        Dim Wks_top As Object, Wks_bot As Object
        Set Wks_top = SurferApp.Documents.Open(FileName:=gridSlice_top)
        Set Wks_bot = SurferApp.Documents.Open(FileName:=gridSlice_bot)

        'Cut column C (the Z values) and paste it into column B
        Wks_top.Columns(Col1:=3).Cut
        Wks_top.Columns(Col1:=2).Paste
        Wks_bot.Columns(Col1:=3).Cut
        Wks_bot.Columns(Col1:=2).Paste

        ' Cut column D (the accumulated distance values) and paste it into column A
        Wks_top.Columns(Col1:=4).Cut
        Wks_top.Columns(Col1:=1).Paste
        Wks_bot.Columns(Col1:=4).Cut
        Wks_bot.Columns(Col1:=1).Paste

        '============================================
        ' Combine the top and bottom DAT files into a single BLN
        '============================================

        ' Fill column C in the the 'bottom' dat file with the row number
        Wks_bot.Transform3 (RangeMin:=1, RangeMax:= Wks_bot.UsedRange.ColumnCount, Equation:="C=row()")

        ' Sort the data in descending order by column C to invert the data
        Wks_bot.Columns(Col1:=1, Col2:=3).Sort(Col1:=3, Order1:=wksSortDescending, Header:=False, MatchCase:=False)

        ' Copy and paste all of the 'bottom' data into the worksheet with the 'top' data
        Wks_bot.Cells(Col:=1, LastCol:=2, Row:=1, LastRow:=Wks_bot.UsedRange.LastRow).Copy
        Wks_top.Cells(Col:=1, Row:=Wks_top.UsedRange.LastRow + 1).Paste(ClipToRange:=False)

        ' Copy and paste row 1 into the first empty row to close the polygon
        Wks_top.Rows(Row1:=1).Copy
        Wks_top.Cells(Col:=1, Row:=Wks_top.UsedRange.LastRow + 1).Paste(ClipToRange:=False)

        'Count the number of rows and puts that into an empty row at the top of the file
        'This is the BLN header row
        nrows = Wks_top.UsedRange.RowCount
        Wks_top.Rows(Row1:=1).Insert
        Wks_top.Cells("A1").Value = nrows

        'Save the file and close the worksheet windows
        combinedBLN = path + "Formation" + Str(i) + " combined.bln"
        Wks_top.SaveAs(FileName:=combinedBLN)
        Wks_top.Close(SaveChanges:=srfSaveChangesNo)
        Wks_bot.Close(SaveChanges:=srfSaveChangesNo)

        '============================================
        ' Add the formation as a base layer to the plot documnet
        '============================================

        ' Check if a map frame already exists
        If MapFrame Is Nothing Then

            ' Create the new base layer under a new map frame
            Set MapFrame = Plot.Shapes.AddBaseMap(ImportFileName:=combinedBLN)
            Set BaseLayer = MapFrame.Overlays(1)

        Else ' Create the new base layer under the existing map frame
            Set BaseLayer = Plot.Shapes.AddVectorBaseLayer(Map:=MapFrame, ImportFileName:=combinedBLN)

        End If

        ' Fill each formation with a different color
        With MapFrame.Overlays(i).Fill
            .Pattern = "Solid"
            .ForeColorRGBA.Red = (i - 1) * Interval
            .ForeColorRGBA.Green = (i - 1) * Interval
            .ForeColorRGBA.Blue = (i - 1) * Interval
        End With

    ' Move on to the next formation
    Next i

' Set the MapFrame limits to the extents of all data
MapFrame.SetLimitsToData

End Sub
Function SurferApplication()
    ' This function returns the current instance of Surfer if one is already running;
    ' otherwise, it creates a new instance.

   On Error Resume Next
   Set SurferApplication = GetObject( ,"Surfer.Application")
   If Err.Number <> 0 Then
      Set SurferApplication = CreateObject("Surfer.Application")
   End If
   On Error GoTo 0
End Function
Function RemoveFileExtension(fileName As String) As String
    Dim dotPosition As Long

    ' Find the position of the last dot in the file name
    dotPosition = InStrRev(fileName, ".")

    ' If a dot is found, remove the extension; otherwise, return the original string
    If dotPosition > 0 Then
        RemoveFileExtension = Left(fileName, dotPosition - 1)
    Else
        RemoveFileExtension = fileName
    End If
End Function
Comments
Please sign in to leave a comment.