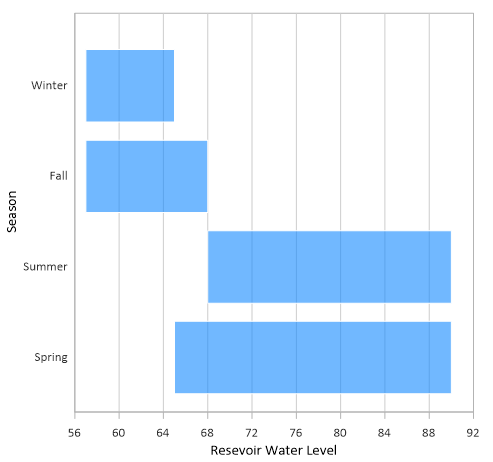
Bar chart data often uses categories or descriptions for each set of bar data. Instructions for creating a horizontal category floating bar chart are provided below.
- Click Home | New Graph | Bar | Horizontal floating bar chart.
- In the Open Worksheet dialog, select your data file and click Open.
- Click the floating bar chart in the Object Manager to select it.
- On the Plot page in the Property Manager, check the box next to Data in rows if your data is in rows rather than in columns.
- Set the Y variable to Sequence number and set the X variable and X2 variable to the desired data columns/rows.
- Click the Y Axis in the Object Manager to select it.
- Click the Labels tab in the Property Manager.
- Click in the Label source field and select From worksheet.
- Click in the Worksheet field and select your open worksheet.
- If your text categories are listed in a row rather than a column, check the box next to Data in rows.
- Click in the Data variable field and select Sequence number.
- Click in the Label variable field and select the column/row containing the text categories.
- If your data has a header row/column, click the + next to Worksheet range to expand the section, and then increase the value in the First row or First column field to 2.
Updated May 2023
Comments
Please sign in to leave a comment.