To show plot labels with multiple lines, you will need to insert extra characters into the worksheet's label column. For instance, suppose your data looks like the data shown below:
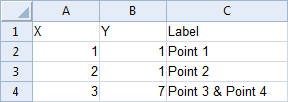
Sample data with X, Y, and label columns.
In the third line, at the &, you may want a second line for the label. Click in cell C4 and place the cursor just before the &. Type \n and leave a space after the text. If you don't want the & to appear, you can remove the &. Your text might look like:
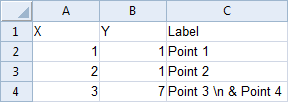
The same sample data with X, Y, and label columns.
The last label has the \n designator, to indicate a new line.
Now that the data has been updated, follow these steps to create the graph and add the labels:
- Highlight columns A and B and click the Home | New Graph | Basic | Scatter Plot command (
 ).
). - Click on the scatter plot layer in the Object Manager to select it.
- In the Property Manager, click on the Labels tab.
- Change the Label variable to Column C: Label.
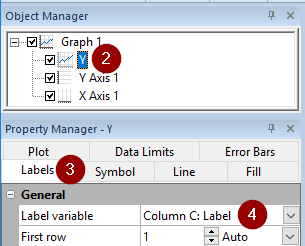
The above instructions viewed in the Object Manager and Property Manager.
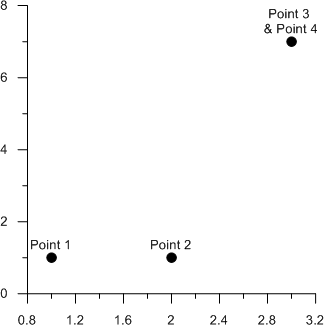
The scatter plot is created with the label spanning two lines.
Updated February 22, 2023
Comments
Please sign in to leave a comment.