Grapher can create a fit curve, limit the fit to a particular range of data, and determine the equation.
- Click on the Line/Scatter Plot in the Object Manager to select it.
- Click Graph Tools | Add to Graph | Fit Curve | Linear Fit or your desired fit type.
- Click on the Fit object in the Object Manager to select it.
- In the Property Manager, click on the Plot tab.
- In the Fitted Plot section, uncheck the box next to Apply fit to entire plot.
- Update the Minimum X plot value to fit (or Minimum X date/time if the values in the data file are formatted as date/time).
- Update the Maximum X plot value to fit (or Maximum X date/time if the values in the data file are formatted as date/time) with the x values for the data range you wish to use.
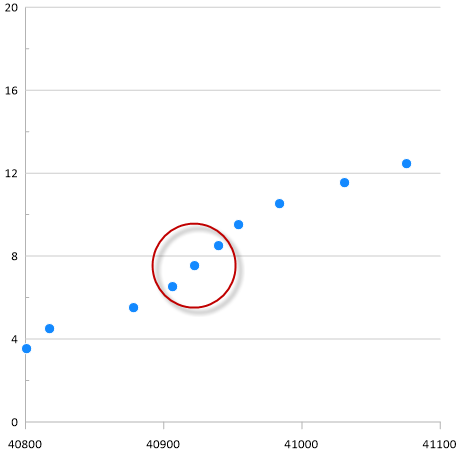
For example, if you were to limit the equation to the area circled in red below, you would enter 40900 for Minimum X plot value to fit and 40945 for the Maximum X plot value to fit.
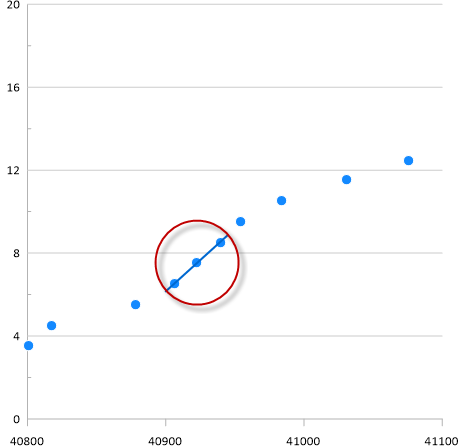
8. After changing the fit curve Fitted Plot properties, your fit curve will be reduced area within the circle.
-
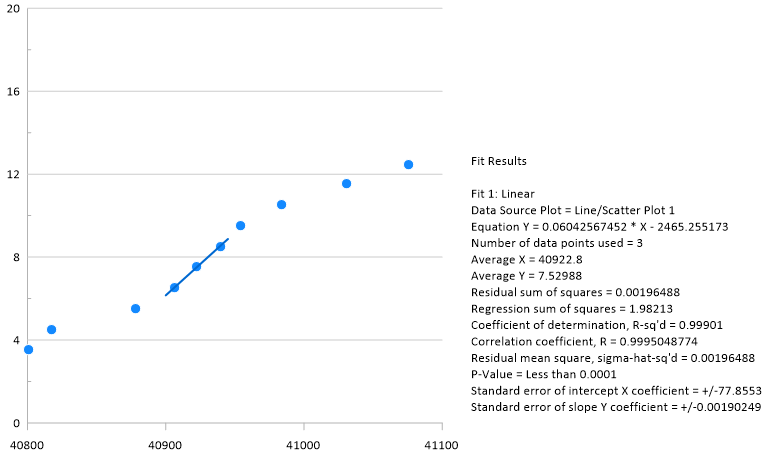
To get the equation of the line:
- Click the Linear Fit plot in the Object Manager.
- In the Property Manager, click on the Plot tab.
- In the Statistics section, set the desired Number format and Significant digits of the numbers in the equation, then click the button next to one of the commands.
- Clicking on the Copy button in the Copy to clipboard field copies the information to the Windows clipboard for pasting into Grapher or another program.
- Clicking on the Display button in the Display report field opens a text window in Grapher with the fit curve information.
- Clicking on the Insert button in the Insert into plot document field allows you to click in the plot document window and have the fit curve information displayed as an editable text object.
Updated April 2023
Comments
Please sign in to leave a comment.