| Create a post map from an XY data file that contains magnitude and direction data |
| Calculate magnitude and direction for the data points before creating either map above |
Create a vector map with grid files
Surfer can create vector plots from a single grid file, or from two grid files individually containing direction and magnitude information in either polar or Cartesian coordinates.
Single grid file:
If you have an XYZ data file, you can grid the data and create a 1-grid vector map. The 1-grid vector map calculates the maximum slope and slope direction from the Z values in the GRD file to draw vectors with magnitude and direction.
- Click Home | New Map | Specialty | 1-Grid Vector.
- Select the grid file and click Open. The vector map is created.
Two grid files:
If you have a data file with X,Y, direction, and magnitude data or starting XY and ending XY data, you can grid the data twice; once to create a grid of directions or changes in X, and once to create a grid of magnitudes or changes in Y. Then, you can create a 2-grid vector map. The 2-grid vector map draws vectors based on two grid files containing the X and Y components or the magnitude and direction components. For more information, see: Gridding directional data in Surfer
- Click Home | New Map | Specialty | 2-Grid Vector.
- Select the first grid file and click Open. This is the grid with the X component or angle component, depending on the coordinate system.
- Select the second grid file and click Open. This is the grid with the Y component or magnitude component, depending on the coordinate system. The vector map is created.
- If your grid file Z values are polar coordinates, angle and magnitude, select the Vectors layer in the Contents window and set the Coordinate system property to Polar (angle, length) in the Properties window Data page.
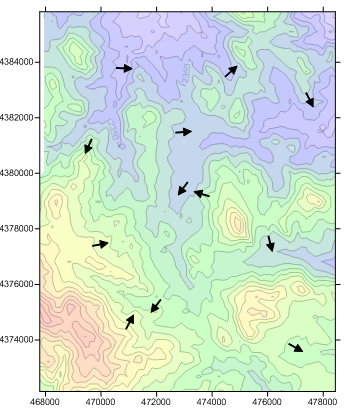
Create a post map from an XY data file that contains magnitude and direction data
If you have an XY data file that includes magnitude and direction data, you can quickly display vectors at XY locations by creating a post map with proportional scaling and an angle column.
- Combine the magnitude and direction information into a single file with your XY point location coordinates.
- Create a post map with the Home | New Map | Post command; select your data file and click Open.
- Select the Post layer in the Contents window.
- In the Properties window, click on the Symbol tab.
- In the Symbol section, expand Symbol properties and select a Symbol Set and Symbol. Some recommended symbols include:
- GSI Default Symbols 60 and 61 plot the center of the arrow at that location.
- GSI Default Symbols 62 and 63 plot the base of the arrow at the XY coordinate.
- For wind arrows, select the GSI Wind Barb Symbols set.
- In the Symbol Angle section, change the Angle column to the column containing the direction information.
Note: Surfer rotates the symbol in the counter-clockwise direction. You can use the Transform command in the worksheet to multiply the direction column by -1 to reverse the rotation direction. - In the Symbol Size section, change the Sizing method to Proportional.
- Click on the Scaling button.
- Set the Worksheeet Column Containing Height to the column containing the magnitude data. Change the Symbol Height values if you want and click OK.
Calculate magnitude and direction for the data points before creating either map above
If your file does not include direction and magnitude data, but you would still like to use it to create a post map with vectors at specific XY locations, continue with the following steps to have Surfer calculate the direction and magnitude at each data point.
- If you do not already have a grid of the XYZ data for your points, click Home | Grid Data | Grid Data, select the data file and click Open. Select the gridding parameters (or accept the defaults) and click OK in the Grid Data dialog to create the grid.
- Click Grids | Calculate | Calculus to create the magnitude grid. The Grid Calculus dialog is displayed.
- In the Grid Calculus dialog, click Browse to select the grid. If you have already created a map from your grid, such as a contour map, you can select the grid in the Input Grid list.
- If you wish to calculate slope for your magnitude data, select Terrain Modeling | Terrain Slope. This will be a grid of the steepest slope (in degrees) at each grid node. If you wish to calculate gradient for your magnitude data, select Differential & Integral Operator | Gradient Operator. This will be a grid of maximum gradient (in rational numbers: rise over run) at each grid node.
- Specify a grid file name in the Output Grid section, such as magnitude.grd.
- If Add grid as a layer to is checked, clear the Add grid as layer to option.
- Click OK. This will create a grid file of the slope or gradient, depending on your selection in step (2.2).
- Click Grids | Calculate | Calculus again to create the direction grid.
- Select the original grid from the Input Grid list, or click Browse to select the original grid.
- Select Terrain Modeling | Terrain Aspect. This will be a grid of the direction of the steepest slope at each grid node.
- Specify a grid file name in the Output Grid section, such as slopeDirection.grd.
- If Add grid as a layer to is checked, clear the Add grid as layer to option.
- Click OK. This will create a grid file of the downhill direction of the steepest slope.
- Next, we need to transform the slope direction grid values with the Grid Math command. The slope direction grid points downhill, and the polar coordinates are set to 0 = north and to rotate clockwise. However, the post map rotates symbols counter-clockwise with increasing angle. Click the Grids | Calculate | Math command.
- Click Add Grids... and select the slope direction grid in the Open Grid(s) dialog.
- Enter one of the following functions in the Enter a function of the form f(A,B,...) where A, B, ... are the variables in the list above field:
- To keep the slope (downhill) direction but rotate symbols clockwise with increasing angle, type A*-1. Name the grid in the Output Grid field, such as PostSlopeDirection.grd.
- To point the vector symbol in the gradient (uphill) direction and change the symbol rotation direction to clockwise with increasing angle, type (A+180)*-1. Name the grid in the Output Grid field, such as PostGradientDirection.grd.
- Clear the Add grid as layer to option and click OK. The grid is created.
- Click Grids | Calculate | Point Sample to generate a data column of direction values.
- In the Point Sample dialog, click Browse and select the PostSlopeDirection.grd or PostGradientDirection.grd grid file in the Open Grid dialog.
- Set the data file used to create the original grid as XY Data. This data file should have XY coordinates for each point where you want a vector.
- In the Data Columns section, assign the X and Y columns from the data file to X and Y.
- Choose a column to store the values. By default, Surfer chooses the first empty column.
- Click OK. A worksheet opens with the XY data values and new grid values for each XY point in the selected column.
- Change the Grid Value column header to Direction.
- Click File | Save and save the file.
- Click File | Close and close the file.
- Click Grids | Calculate | Point Sample again to generate a data column of magnitude values.
- In the Point Sample dialog, click Browse and select the magnitude grid file in the Open Grid dialog.
- Click Browse in the XY Data section and select the data file saved in step (7.0) in the Open Data dialog.
- In the Data Columns section, assign the X and Y columns from the data file to X and Y.
- Choose a column to store the values. By default, Surfer chooses the first empty column.
- Click OK. A worksheet opens with the XY data values and new grid values for each XY point in the selected column.
- Change the Grid Value column header to Magnitude.
- Click File | Save and save the file.
Now you can create a post map to display the data by following the steps in the Create a post map from an XY data file that contains magnitude and direction data section above.
Comments
Please sign in to leave a comment.