Prerequisite: Creating Grid Files with Matching Limits
To successfully build a solid volumetric block model, you must have independent grid files (.GRD) representing the top surface and every subsequent subsurface boundary layer you wish to display within the diagram. For the best results, ensure these grid files share the same X and Y coordinate extents.
When gridding your data components via Home | Grid Data | Grid Data, use the following techniques in the Output Grid Geometry section to guarantee a perfect match:
The 'Copy Geometry From' Tool
Instead of manually typing coordinate bounds for every single geological layer, you can dynamically inherit settings from an existing asset.
Locate the Output Grid Geometry section on the final Output page of the gridding wizard.
-
Use the Copy geometry from dropdown menu to do one of the following:
select a layer already active in your current map workspace.
click the Browse button to point directly to an external, pre-existing master grid file (such as your top surface layer).
Surfer will instantly overwrite the X and Y minimum/maximum extents, node counts, and directional spacing to mirror the template file exactly. Select <None> if you ever need to reset to defaults and enter data ranges manually.
Saving and Loading Grid Project Configurations
If you frequently map standard project sites or process a large volume of distinct stratigraphic columns, you can save your dialog settings.
Once your master grid layout (including columns, density parameters, and boundaries) is configured, click the Save Settings button at the bottom of the dialog panel on the final Output page of the gridding wizard.
This exports a standalone Grid Data Settings (.GDS) file containing every constraint used across all configuration windows.
For all future subsurface layers, simply load this custom
.GDSconfiguration file on the first page (Select Data) of the gridding wizard.
Step-by-Step Block Diagram Workflow
Once your matching grid files are prepared, follow these instructions to load your surfaces and apply solid block fills:
- Click Home | New Map | 3D Surface | Surface, select one of the grid files and click Open.
- Add the other grids as 3D surfaces by selecting the existing map and clicking Home | Add to Map | Layer | 3D Surface.
- Select one of the 3D Surface layers in the Contents window.
- In the Properties window, on the General tab, enable the Show base option.
- Expand the Line Properties and Fill Properties sections and adjust the properties as desired.
- Repeat Steps 3-5 for each of the 3D Surface layers created.
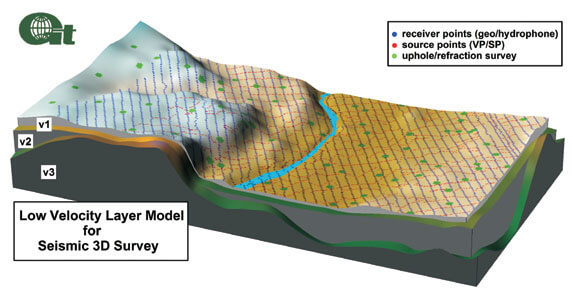
Surfer 3D block diagram illustrating seismic survey results
For an example, please see the attached SRF file, BlockDiagram.srf. In this example the Grids | Calculate | Math feature was used to add 150 to the Z values in Demogrid.grd (from the Surfer\Samples\ folder) to create the upper surface.
Additional Resources
- Golden Software Blog
Comments
Please sign in to leave a comment.