Boundary files also called NoData Polygons or BLN files are very useful tools when creating Surfer maps. The most common use for a NoData Polygon in Surfer is to assign NoData to a grid file. Surfer supports several methods of creating a NoData polygon or BLN file. Each method is outlined below with the top three being most recommended.
| Topics covered in this article |
|
Create an alpha shape around your data Draw the polygon in an empty base layer Export a single contour line from a contour map |
|
Golden Nugget : A BLN file is not required to Assign NoData, but it is needed if you'd like to use a fault or breakline during gridding. |
Create an alpha shape around your data
If you have collected data within an area and you want to define a boundary around the collected data, an alpha shape is the perfect solution. Alpha Shapes allow you to create a tight polygon boundary around your data points. They can create a concave or convex hull around data points depending on how tight the polygon clings around the data limits.
To create an alpha shape, your point data must be imported as a base layer and not a post layer.
- Click Home | New Map | Base | Base from Data, select your data file, and click Open.
- In the Base from XY Data dialog, make any necessary adjustments and click OK.
- Click the Base(vector) layer to use all points in the layer or select 3 or more points inside the layer to use a subset of the imported data.
- Click Features | New Features | Alpha Shape.
- In the Alpha Shape dialog,
- Enter an Alpha value. The larger the value the more convex the polygon will be, and the smaller the number the more concave the polygon will be.
- Click in the Destination layer and select New Layer, if desired.
- If you'd like to see what the resulting polygon will look like, click Preview.
- Click OK.
- If needed, export the polygon as a BLN file:
- Click the new Base(vector) layer to select it.
- On the General tab of the Properties window, click the Save icon in the Input file field.
- In the Export dialog, select BLN Golden Software Blanking, enter a File name, and click Save.
Draw the polygon in an empty base layer
If you can identify the boundary based on a satellite image or other context layer data then you can draw the polygon in Surfer. To ensure the drawn boundary uses the same coordinates as your map, it should be drawn in a base layer as outlined below.
- Select your map and click Home | Add to Map | Layer | Empty Base.
- Select the Base(vector) layer in the Contents window.
- Click Features | Insert | Polygon and draw your polygon over the map. You may also draw a rectangle, rounded rectangle, or ellipse and use this method.
- Double click when you are finished to end the polygon. Now the base map layer has one polygon object in it.
- Press the ESC key on the keyboard to exit drawing mode.
- If needed, export the polygon as a BLN file:
- Click the new Base(vector) layer to select it.
- On the General tab of the Properties window, click the Save icon in the Input file field.
- In the Export dialog, select BLN Golden Software Blanking, enter a File name, and click Save.
Export a single contour line from a contour map
You may occasionally need to define a boundary at a specific elevation or Z value. For example, if you're surveying a lake, the elevation of the shore line would be a useful boundary. Rather than manually drawing the polygon or using the data limits which likely do not include very shallow areas, you can export a single contour from Surfer to create the boundary file.
Note that you will need a grid file representing the area's topography to complete this process.
- Click Home | New Map | Contour, select the topographic grid file, and click Open.
- In the Contents window, click the Contours layer.
- In the Properties window, click the Levels tab.
- Change both the Minimum contour and Maximum contour to the Z level of interest. For example:
- Uncheck the box next to Show labels.
- Click File | Export
- In the Export dialog,
- Check the box next to Selected objects only.
- Change the Save as type to BLN,
- Enter a File name and click Save.
- In the Export Options dialog, ensure the Scaling source is set to Map and click OK.
Digitize the Boundary
If you do not know the coordinates for the boundary, but you can visually pick them off a map in Surfer, then you can digitize them. This is very similar to drawing the polygon in a base layer. The primary difference is that the coordinates can be edited in the Digitized Coordinates dialog as you go. Note that this process does not automatically add the polygon to the map.
- Select the Map and click Map Tools | Layer Tools | Digitize. Your cursor will turn into a cross hair.
- Click on the first point. The coordinates of that point will be entered in the Digitized Coordinates window.
- Digitize all around the boundary in order, either clockwise or counterclockwise.
If you are creating a polygon, ensure the last point is the same as the first. - Click the Options menu in the Digitized Coordinates window and check or uncheck the NoData Inside Region command as needed. If this option is checked, the BLN file will be saved with a blanking flag of 1 indicating areas inside the boundary will be assigned a NoData value.
- Click File | Save As in the Digitized Coordinates window and save to a BLN file.
Enter the coordinates manually
If you know the exact coordinates of your boundary, you can enter them directly into the worksheet to create a BLN file.
A BLN file consists of a one line header followed by a list of XY points. The one line header is the number of proceeding data points. If you are using the BLN file for assigning NoData values to a grid, then the header will also need to contain a 1 or a 0 (the blanking flag number) in column B. A 1 means to assign NoData values inside the boundary and a 0 means to assign NoData values outside the boundary. If you are not using the BLN file for assigning NoData values, then it doesn’t matter if a 1 or a 0 is entered as the blanking flag in column B.
If you have 1 data point in your BLN file, then you are creating a point location. If you have 2 or more data points, then this will be described as a line. If you have multiple data points, and the first and last coordinate set are the same, then this is a polygon.
- Click File | New | Worksheet
- In cell A1, enter the number of points in your polygon.
- Enter the polygon coordinates in the following rows with the X coordinate in Column A and the Y coordinate in Column B.
- Click File | Save As and save to a BLN file.
Example BLN files:
A BLN file with two points:
1
5,6
1
4,3
A BLN file with two points and one polyline (made of three points connected together):
1
5,6
1
4,3
3
1,1
4,2
6,5
A BLN file with two points, one polyline, and one polygon:
1
5,6
1
4,3
3
1,1
4,2
6,5
5
0,0
5,0
3,4
1,4
0,0
This will look like: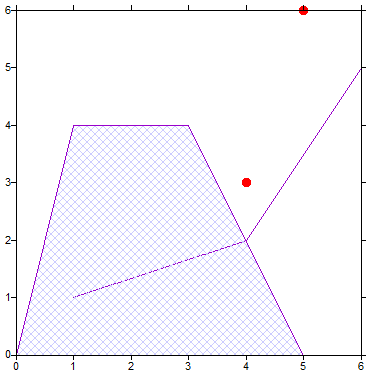
A BLN file with one polygon that will be used to assign NoData values to a grid file (outside the boundary):
5,0
0,0
5,0
3,4
1,4
0,0
Additional Resources
Comments
Is there a way to automatically create a polygon that would follow the limits of the input data or the limits of an image? this would be very useful when combining multiple data files.
Hi Olivier,
Surfer does not currently offer the ability to generate a polygon or BLN file based on the limits of input data. I have added your vote for this feature to our suggestion file. If you have a few moments, it would be beneficial to our development team if you could provide an example workflow or situation where this feature would save you time. Please send any additional information you care to share to support@goldensoftware.com.
Thank you,
Katie Yoder
Golden Software Support
Please sign in to leave a comment.