It is not possible to create a grid from a data file that does not have variation in the Z column using the Grid Data command. To create a horizontal planar grid, either add slight variation to the Z values in the data file (e.g. one point's Z value is different by 0.000001 from the other points), or create a horizontal grid using the Grids | New Grid | Function command.
For example:
-
- Click Grids | New Grid | Function.
- In the Grid Function dialog,
- Enter the desired X and Y Minimum and Maximum values for the grid.
- Set the desired Increment value. This is the spacing of the grid nodes. Since the grid is horizontal, this does not have to be a high resolution grid file.
- Enter the function Z=75, where 75 is the Z value for the horizontal plane.
- Give the grid a new name/location in the Output Grid field (if desired).
- Check Add grid as layer to: if you want to add the newly generated grid to the active project.
- If the above option is checked, you can also specify what type of map layer you want to add to the project by setting the New layer type option. You can select any layer option, except Contour. Contour maps cannot be created from horizontal planar grids.
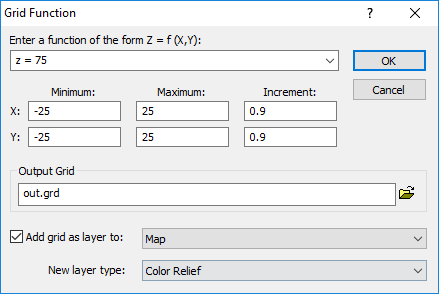
Enter the function where Z equals the Z value you want for the horizontal plane.
- Click OK. The grid file and map or layer (if selected) are created.
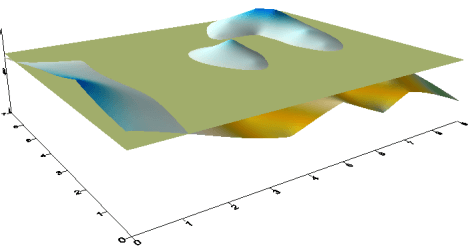
The horizontal grid is created with Grid Function and can be used to create maps or depict horizontal planes, such as water levels or a ground surface.
Updated October, 2021
Comments
Please sign in to leave a comment.