The Grids | Calculate | Slice and Map Tools | Add to Map | Profile commands are both ways you can create a topographical profile of your grid. However, there are some differences.
Profiles are very quick and easy to create. You simply click on the map to draw the section line and the profile is automatically created. You can fill under the profile object easily. The profile will show lines representing each of the grids in the map. Limits and scaling can both be changed on their respective tabs in the Properties.
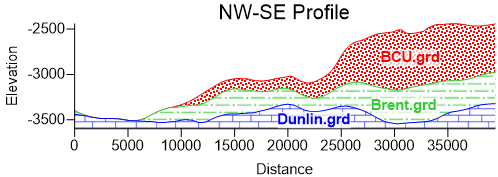
Profiles are used to easily display topographical profiles by interactively
clicking the points on the map to create the section line.
The Grid | Calculate | Slice function takes more steps than adding a profile to view the topographical profile line, and more steps to fill under the profile line - but this method provides more section data. This tool can create both a data file and a BLN as output files. The BLN can be used to create a base map, while the DAT file can specify exact XY coordinates as well as the distance along the profile line. Grid Slice can only work on one grid file at a time, whereas the Profile tool can be used on multiple grid files
Grid | Calculate | Slice may not be as easy, but you can specify the
precise vertices for the section line.
Please see these related articles for instructions on the usage of both options to create cross sections:
- How do I create a cross section in Surfer?
- I created a Profile in Surfer, but what is the scale, and can I change it?
- For the Surfer Profile, what are the units of the X and Y axes?
Choose the Interpolation type for Image Slices
Image slices are a powerful way to emphasize or display the contents of a 3D grid along a specific cutting plane. They can show colorful detailed images through your data. You have the option now to select the interpolation method for the images. You can select Tri-linear interpolation, which creates a very nice image with smooth gradations between the colors; or, if you want more precise coloring, you can now select Nearest Neighbor interpolation. Choose nearest neighbor interpolation for your image slices, and have distinct colors next to each other without interpolation and gradation in between.
In this example, the image slice in the background uses Nearest Neighbor interpolation and matches the drillhole data exactly (accounting for angle of view)
Comments
Please sign in to leave a comment.