You can label the angle axis for a polar plot to indicate degrees, radians, or grads in Grapher.
If your wind direction data is in compass direction rather than an angle in degrees, see here: Transform compass direction to angle (degrees) in Grapher. Once you convert your wind direction data to numbers, follow the steps below to display compass directions as axis labels.
To display compass directions:
- Create two columns in your worksheet for the angle direction and compass text. The Angle column contains the angle direction in degrees where the axis label should be located. The Compass column contains the label text that you would like displayed for each label.
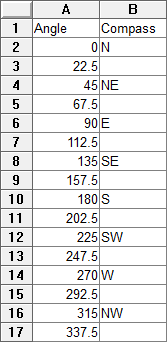
Column A contains the angle direction.
Column B contains the label text.
- Create the polar plot as normal by clicking the appropriate Home | New Graph | Polar command.
- In the Open Worksheet dialog, select your data file.
- Click Angle Axis 1 in the Object Manager to select it.
- In the Property Manager, click the Labels tab.
- Click in the Label source field and select From worksheet.
- Click None in the Worksheet field and select your data file with the two new columns. If you created a new worksheet for the axis labels, click Browse and select the worksheet in the Open Worksheet dialog.
- Set the Data variable to the Angle column.
- Set the Label variable to the Compass column.
Your Polar diagram will now show compass direction points as labels. You can have as many or few directions as you want.
Note:
In the original worksheet, some rows did not have labels. These are shown on the graph as tick marks with no labels. The angle value should be included anywhere a tick mark is desired.
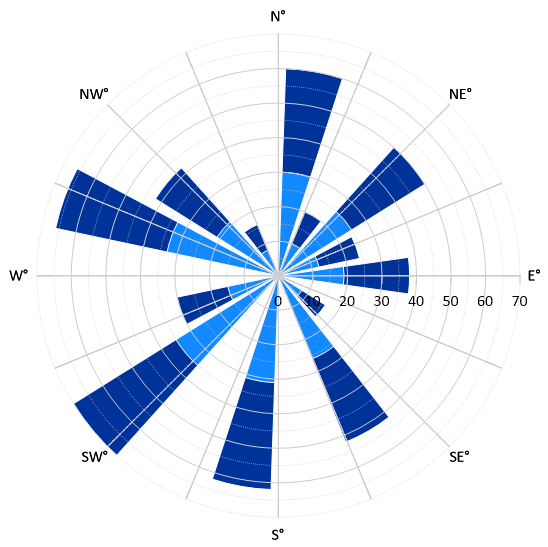
Polar graph displaying compass direction instead of degrees.
Updated May 2023
Comments
Please sign in to leave a comment.