A bubble map is a data visualization tool used to represent numerical values at specific geographic locations using circles (bubbles). Each bubble is positioned on a map based on its coordinates, and its size reflects the magnitude of the associated data value. The larger the bubble, the greater the value it represents.
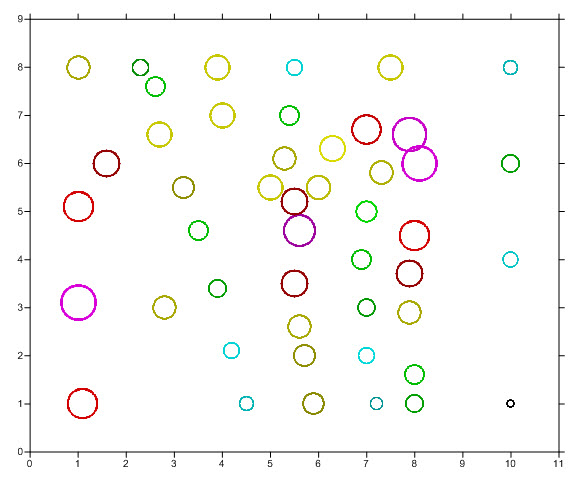
Bubble map created using the Surfer post map with
proportional symbol sizes.
To create this type of map in Surfer:
- Click Home | New Map | Post.
- Select the data file and click Open. The map is created with the default parameters.
- Select the Post layer in the Contents window.
- In the Properties window, click the Symbol tab.
- Expand the Symbol Properties section.
- Click in the Symbol field and select the desired symbol, such as the open or filled circle symbols.
- Under Symbol Size, set the Sizing method to Proportional.
- Under that, click the Scaling button to display the Proportional Scaling dialog.
- Set the Worksheet Column Containing Height to the data column to control the symbol size.
- Specify the desired Symbol Height and Data Value to map the symbol size to the data values, then click OK.
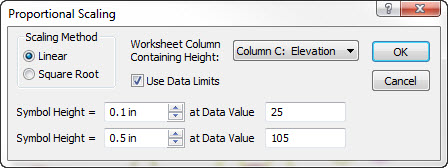
Specify the Worksheet Column Containing Height, Symbol
Height, and Data Values to control the symbol sizes.
Comments
Please sign in to leave a comment.