A Piper diagram, also known as a Piper trilinear diagram or ternary diagram, is a chart used in geochemistry to illustrate the composition of water or sediment samples based on their chemical constituents. Grapher simplifies the generation of Piper diagrams, ultimately giving you the tools to help your stakeholders make informed decisions related to water resource management, land use planning, and environmental protection.
- What is a Piper (Trilinear) diagram?
- Creating a Piper (Trilinear) diagram in Grapher
- Piper (Trilinear) diagram creation training video
- Additional Piper (Trilinear) diagram resources
What is a Piper (Trilinear) diagram?
A Piper (trilinear) diagram or plot is a chart used in hydrogeology to visualize the chemical composition of water from a particular aquifer or location.
The diagram consists of two triangle ternary diagrams and a diamond plot in the middle. The lower left triangle represents the relative proportion of major cations (such as calcium, magnesium, and sodium) and the lower right triangle represents major anions (such as bicarbonate, sulfate, and chloride) in the water sample. The corners of each triangle represent the chemical composition of pure water with respect to the three ions represented by that triangle.
The diamond plot in the middle is a matrix transformation of the two ternary diagrams. Each sample is normalized (sum of cations = 100 and sum of anions = 100), so relative concentrations are represented as percentages.
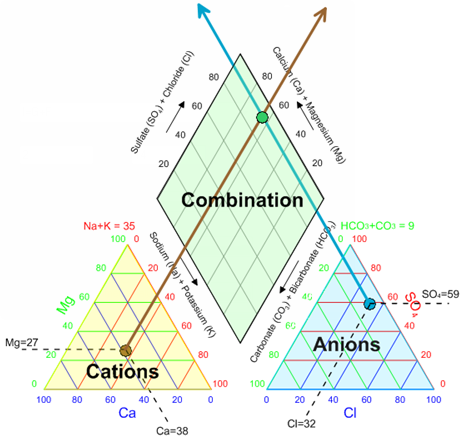
The three components of the Piper diagram. Bottom left is a ternary plot of the cations, bottom right is a ternary plot of the anions, and top is a diamond plot of a projection from the other two plots.
How to read a Piper (Trilinear) diagram:
By analyzing the diamond plot in the center of a Piper diagram scientists can categorize samples into hydrochemical facies.
Samples in the top quadrant are calcium sulfate waters, which are typical of gypsum ground water and mine drainage. Samples in the left quadrant are calcium bicarbonate waters, which are typical of shallow fresh groundwater. Samples in the right quadrant are sodium chloride waters, which are typical of marine and deep ancient groundwater. Samples in the bottom quadrant are sodium bicarbonate waters, which are typical of deep groundwater influenced by ion exchange.
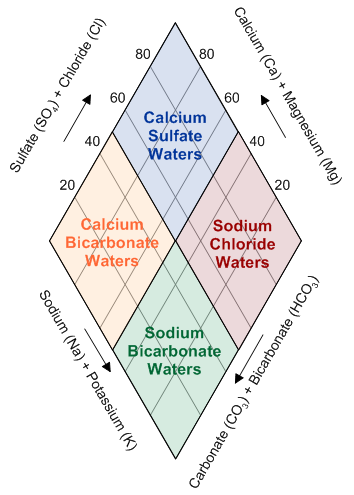
Interpretation of the diamond plot (modified from inside.mines.edu | WaterChem2pdf).
Why is a Piper (Trilinear) diagram used?
Once a sample has been categorized into hydrochemical facies hydrogeologists can infer information on the geochemical processes that water sample has gone through. Including the geological formations groundwater has passed through, potential contamination sources, and the suitability of water for human consumption.
Knowledge of these processes help track changes in the aquifer over time. Ultimately, guiding stakeholder decisions related to water resource management, land use planning, and environmental protection.
Creating a Piper (Trilinear) diagram in Grapher
- Click Home | New Graph | Ternary and select your desired plot type from Piper and Piper Class Scatter
- In the Open Worksheet dialog, select your data file and click Open. The Piper plot is created with the data columns assigned in the following order: cation X, cation Z, cation Y, anion X, anion Z, and anion Y.
Piper plot column assignments in your data by column.
- Adjust the data columns being plotted as the X,Y,Z, or class variable as needed
- In the Property Manager, click the Plot tab
Once the plot is created the data columns being plotted as the X,Y,Z, or class variable can be adjusted in the Plot tab of the Property Manager after clicking on the Cation or Anion Plot in the Object Manager.
Piper (Trilinear) diagram creation training video
For additional information on customizing a Piper plot in Grapher watch the training video below.
Additional Piper (Trilinear) diagram resources
- Grapher Help > Piper Plot and Piper Class Scatter Plot
- Grapher Help > Graph Page - Piper Plots (Set the overall graph properties for the piper diagram)
- Grapher Help > Plot Page - Piper Diagrams and Durov Plots (Change the data file and set data used in the anion and cation ternary plots)
Comments
Please sign in to leave a comment.